RRDTools – Least Square Lines
2007-07-26 | 4:20 pm | Kein Kommentar »
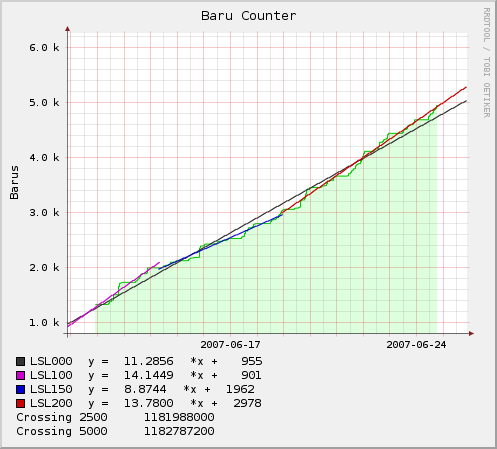
Least Square Lines with LSLSLOPE, LSLINT
LSLSLOPE and LSLINT return the parameters for a Least Squares Line (y = mx +b) which approximate the provided dataset. LSLSLOPE is the slope (m) of the line related to the COUNT position of the data. LSLINT is the y-intercept (b), which happens also to be the first data point on the graph.
rrdtool graph baruLSL.png \
–title „Baru Counter“ \
–vertical-label Barus \
–start 1181500000 \
–end 1182800000 \
–x-grid HOUR:12:DAY:1:DAY:7:0:%Y-%m-%d \
DEF:baru=baru00.rrd:baru:AVERAGE \
AREA:baru#ddffdd \
LINE1:baru#00cc00 \
VDEF:slm=baru,LSLSLOPE \
VDEF:slb=baru,LSLINT \
CDEF:ls=baru,COUNT,EXC,POP,slm,*,slb,+ \
LINE1:ls#333333:LSL000 \
COMMENT:“y =“ \
GPRINT:“slm:%4.4lf“ \
COMMENT:“*x +“ \
GPRINT:“slb:%4.0lf\n“ \
DEF:baru100=baru00.rrd:baru:AVERAGE:end=start+100h \
VDEF:slm100=baru100,LSLSLOPE \
VDEF:slb100=baru100,LSLINT \
CDEF:ls100=baru100,COUNT,EXC,POP,slm100,*,slb100,+ \
LINE1:ls100#cc00cc:LSL100 \
COMMENT:“y =“ \
GPRINT:“slm100:%4.4lf“ \
COMMENT:“*x +“ \
GPRINT:“slb100:%4.0lf\n“ \
CDEF:cr2500=baru,COUNT,EXC,POP,slm,*,slb,+,2500,LT,TIME,0,IF \
VDEF:crp2500=cr2500,MAXIMUM \
CDEF:cr5000=ls,5000,LT,TIME,0,IF \
VDEF:crp5000=cr5000,MAXIMUM \
COMMENT:“Crossing 2500 “ \
GPRINT:“crp2500:%12.0lf\n“\
COMMENT:“Crossing 5000 “ \
GPRINT:“crp5000:%12.0lf\n“
COUNT pushes the number 1 if this is the first value of the data set, the number 2 if it is the second, and so on. This special value allows you to make calculations based on the position of the value within the data set.
POP removes the top element of the stack.
EXC exchanges the two top elements.


Sag etwas dazu: