RRDTools – The Basics
2007-07-19 | 5:03 pm | Kein Kommentar »
Round Robin Database Tool is a data logging and graphing system for time series data. It works with a fixed amount of data.
RRD Set Up
Set up of an RRD called baru.rrd which accepts one number of baru value every 600 seconds. If no new data is supplied for more than 86400 seconds, the number of baru becomes *UNKNOWN*. The minimum acceptable value is 0 and the maximum is 5000.
rrdtool create baru00.rrd \
–start 1181500000 \
–step 600 \
DS:baru:GAUGE:86400:0:5000 \
RRA:AVERAGE:0.5:6:480
step specifies the base interval in seconds with which data will be fed into the RRD.
DS:ds-name:DST:heartbeat:min:max – data source
GAUGE is a data source type (details rtfm)
heartbeat defines the maximum number of seconds that may pass between two updates of this data source before the value of the data source is assumed to be *UNKNOWN*. If the interval between samples is less than heartbeat, then an average rate is calculated and applied for that interval. If the interval between samples is longer than „heartbeat“, then that entire interval is considered „unknown“.
min and max define the range of the data.
RRA:CF:xff:steps:rows – round robin archiv
AVERAGE – consolidation function
xff – xfiles factor defines what part of a consolidation interval may be made up from *UNKNOWN* data while the consolidated value is still regarded as known.
steps defines how many of these primary data points are used to build a consolidated data point which then goes into the archive.
rows defines how many generations of data values are kept in an RRA.
RTFM. Further details at the manpage of rrdcreate :)
Feeding new data into the rrd
The update function feeds data values into an RRD. The data format is timestamp:value. Or if you use N:value time is set to current time.
cat $infile | tr “ “ „:“ |
while read line
do
rrdtool update baru.rrd $line
done
RTFM. Further details at the manpage of rrdupdate :)
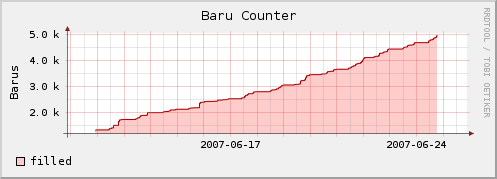
Generating graphics
RRDTool lets you create graphs in PNG format for display on a web browser.
rrdtool graph baru.png \
–title „Baru Counter“ \
–vertical-label Barus \
–start 1181500000 \
–end 1182800000 \
–x-grid HOUR:12:DAY:1:DAY:7:0:%Y-%m-%d \
DEF:baru=baru00.rrd:baru:AVERAGE \
AREA:baru#ccffcc:“filled“ \
LINE2:baru#00aa00
title – defines a title to be written into the graph.
start – time when the graph should begin [time in seconds since epoche]. Negative numbers are relative to the current time.
end – time when the graph should end.
DEF:vname=rrd:ds-name:CF
The DEF call automatically chooses an RRA which contains CF consolidated data in a resolution appropriate for the size of the graph to be drawn. If the resolution of the RRA is the same as the resolution of the graph one data point from the RRA is be represented by one pixel in the graph. If the resolution of the RRA is higher than the resolution of the graph, the data in the RRA will be further consolidated according to the consolidation function (CF) chosen.
RTFM. Further details at the manpage of rrdgraph :)


Sag etwas dazu: